
Related to the below data, if you are in transition, you have to think like an independent contractor.
The way you secure work today is by establishing yourself as an expert and developing opportunities to solve problems in your area of expertise with other folks in the same situation. Crowdsolve. That is the bottom-line.
Make sure you understand Social Media tools as well; build your brand via your Google Profile, a blog, Twitter, LinkedIn and tools like VisualCV.
If you say none of these things are for you or don't relate to you, you will struggle in the current highly competitive climate.
MASS LAYOFFS -- AUGUST 2009
Employers took 2,690 mass layoff actions in August that resulted in the separation of 259,307 workers, seasonally adjusted, as measured by new filings for unemployment insurance benefits during the month, the U.S. Bureau of Labor Statistics reported today. Each action involved at least 50 persons from a single employer. The number of mass layoff events in August increased by 533 from the prior month, and the number of associated initial claims increased by 52,516. Over the year, the number of mass layoff events increased by 803, and associated initial claims increased by 70,356. Year-to-date mass layoff events (21,184) and initial claims (2,162,202) both recorded program highs through August. In August, 900 mass layoff events were reported in the manufacturing sector, seasonally adjusted, resulting in 93,892 initial claims. Over the month, the number of manufacturing events increased by 279, and associated initial claims increased by 21,626. (See table 1.)
During the 21 months from December 2007 through August 2009, the total number of mass layoff events (seasonally adjusted) was 44,669, and the number of initial claims filed (seasonally adjusted) in those events was 4,556,636. (December 2007 was the start of a recession as designated by the National Bureau of Economic Research.)
The national unemployment rate was 9.7 percent in August 2009, seasonally adjusted, up from 9.4 per-cent the prior month and up from 6.2 percent a year earlier. In August, total nonfarm payroll employment decreased by 216,000 over the month and by 5,830,000 from a year earlier.
Industry Distribution (Not Seasonally Adjusted)
The number of mass layoff events in August was 1,428 on a not seasonally adjusted basis; the number of associated initial claims was 125,024. (See table 2.) Average weekly layoff events rose from 285 in August 2008 to 357 in August 2009, and average weekly initial claims increased from 28,000 to 31,256. Seven of the 19 major industry sectors reported program highs in terms of average weekly initial claimants for the month of August: construction; wholesale trade; retail trade; management of companies and enterprises; educational services; arts, entertainment, and recreation; and accommodation and food services. (Average weekly analysis mitigates the effect of differing lengths of months. See the Technical Note.)
The manufacturing sector accounted for 31 percent of all mass layoff events and 33 percent of initial claims filed in August 2009. A year earlier, manufacturing made up 29 percent of events and 37 percent of initial claims. Within manufacturing, transportation equipment comprised the largest number of aver-age weekly claims (2,269) despite experiencing the largest decrease in average weekly initial claims over the year (-1,688) among three-digit NAICS industries. (See table 3.) The administrative and waste services sector accounted for 14 percent of mass layoff events and 12 percent of initial claims, down from 15 and 14 percent, respectively, the previous August. Construction accounted for 11 percent of events and 10 percent of initial claims, an increase from 10 percent of events and 7 percent of claims in August 2008.
Of the 10 detailed industries with the largest number of mass layoff initial claims, 3 reached a series high for August: motorcycle, bicycle, and parts manufacturing; warehouse clubs and supercenters; and casino hotels. The industry with the largest number of initial claims was temporary help services (6,721). (See table A.)
Table A. Industries with the largest number of mass layoff initial claims in August 2009 Geographic Distribution (Not Seasonally Adjusted)
Among the 4 census regions, the West registered the highest number of initial claims in August due to mass layoffs (36,897), followed by the Midwest (32,197) and the South (29,486). (See table 5.) Average weekly initial claims associated with mass layoffs increased over the year in 3 of the 4 regions, with the Northeast experiencing the largest increase (+2,064). In 2009, the Northeast reported its highest August level of average weekly initial claims (6,611) in program history.
Of the 9 geographic divisions, the Pacific (30,781) had the highest number of initial claims due to mass layoffs in August, followed by the East North Central (25,962) and the Middle Atlantic (23,491). (See table 5.) Seven of the 9 divisions experienced over-the-year increases in average weekly initial claims, led by the Middle Atlantic (+1,786). This year, the Middle Atlantic, Mountain, and South Atlantic divisions reached program highs for August in terms of average weekly initial claims.
California recorded the highest number of average weekly initial claims in August, with 6,521, even though it had the largest over-the-year decrease in average weekly claims (-704). The over-the-year decrease was largely due to a drop in claims from the administrative and support services industry. The states with the next highest number of average weekly initial claims were New York (2,851), Pennsylvania (2,481), and Florida (1,949). Thirty states and the District of Columbia experienced over-the-year increases in average weekly initial claims, led by Pennsylvania, New York, and Illinois. In 2009, eight states reached program highs in average weekly initial claims for the month of August: Alaska, Arizona, Hawaii, Illinois, Nevada, New York, Rhode Island, and Wisconsin.
Note
The monthly data series in this release cover mass layoffs of 50 or more workers beginning in a given month, regardless of the duration of the layoffs. For private nonfarm establishments, information on the length of the layoff is obtained later and issued in a quarterly release that reports on mass layoffs lasting more than 30 days (referred to as "extended mass layoffs"). The quarterly release provides more inform-at ion on the industry classification and location of the establishment and on the demographics of the laid-off workers. Because monthly figures include short-term layoffs of 30 days or less, the sum of the figures for the 3 months in a quarter will be higher than the quarterly figure for mass layoffs of more than 30 days. (See table 4.) See the Technical Note for more detailed definitions.
_____________
Mass Layoffs in September 2009 is scheduled to be released on Thursday, October 22, 2009, at 10:00 a.m. (EDT).
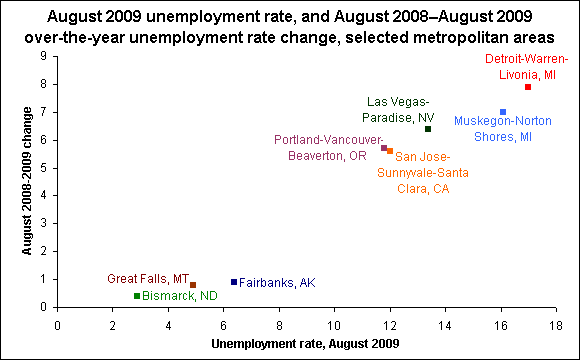
Metropolitan area over-the-year unemployment rate increases, August 2009
For the eighth consecutive month, all of the nation's 372 metropolitan areas had over-the-year unemployment rate increases. The largest jobless rate increase from August 2008 to August 2009 was reported in Detroit-Warren-Livonia, Michigan (+7.9 percentage points), followed by Muskegon-Norton Shores, Michigan (+7.0 points).

Corporate Outplacement and Career Transition Information
Thursday, October 1, 2009
Mass Layoffs Summary from DOL
![]()
![]()

Subscribe to:
Post Comments (Atom)


Texas Unemployment Trends - August 2009
ReplyDeleteTexas Unemployment Trends in Heat Map form:
here is a map of Texas Unemployment in August 2009 (BLS data)
http://www.localetrends.com/st/tx_texas_unemployment.php?MAP_TYPE=curr_ue
versus Texas Unemployment Levels 1 year ago
http://www.localetrends.com/st/tx_texas_unemployment.php?MAP_TYPE=m12_ue